HR Dashboards centralize workforce data into a single view, making HR reporting faster, easier, and more actionable.
Focus on business questions first, then select HR metrics that support decision-making.
Track key metrics such as headcount, turnover, time-to-hire, engagement, absenteeism, and training completion.
Use the BUILD Framework (Begin, Understand, Integrate, Lay Out, Drive) to create an effective HR dashboard in 30 minutes.
The best HR dashboards drive action, helping leaders identify workforce risks, improve performance, and make data-driven decisions.
Imagine your CEO asks three questions before a leadership meeting:
What is our employee turnover rate?
How long does it take us to hire talent?
Which teams have the highest absenteeism?
You open five spreadsheets, two HR systems, and a survey platform to find the answers.
This is exactly why modern HR teams use an HR Dashboard.
A well-designed HR Dashboard brings all critical HR dashboard metrics into one place, helping HR leaders monitor workforce performance, improve reporting accuracy, and make faster decisions. While dashboards provide real-time visibility, organizations still rely on structured HR Reports to communicate workforce insights, trends, and recommendations to stakeholders.
Whether you're building a simple HR reporting dashboard in Excel or a sophisticated HR analytics dashboard in Power BI, the objective is the same: turn workforce data into actionable insights.
In this guide, you'll learn how to build an HR dashboard in just 30 minutes, explore practical HR dashboard examples, understand key implementation considerations, and get a free HR dashboard template you can customize for your organization.
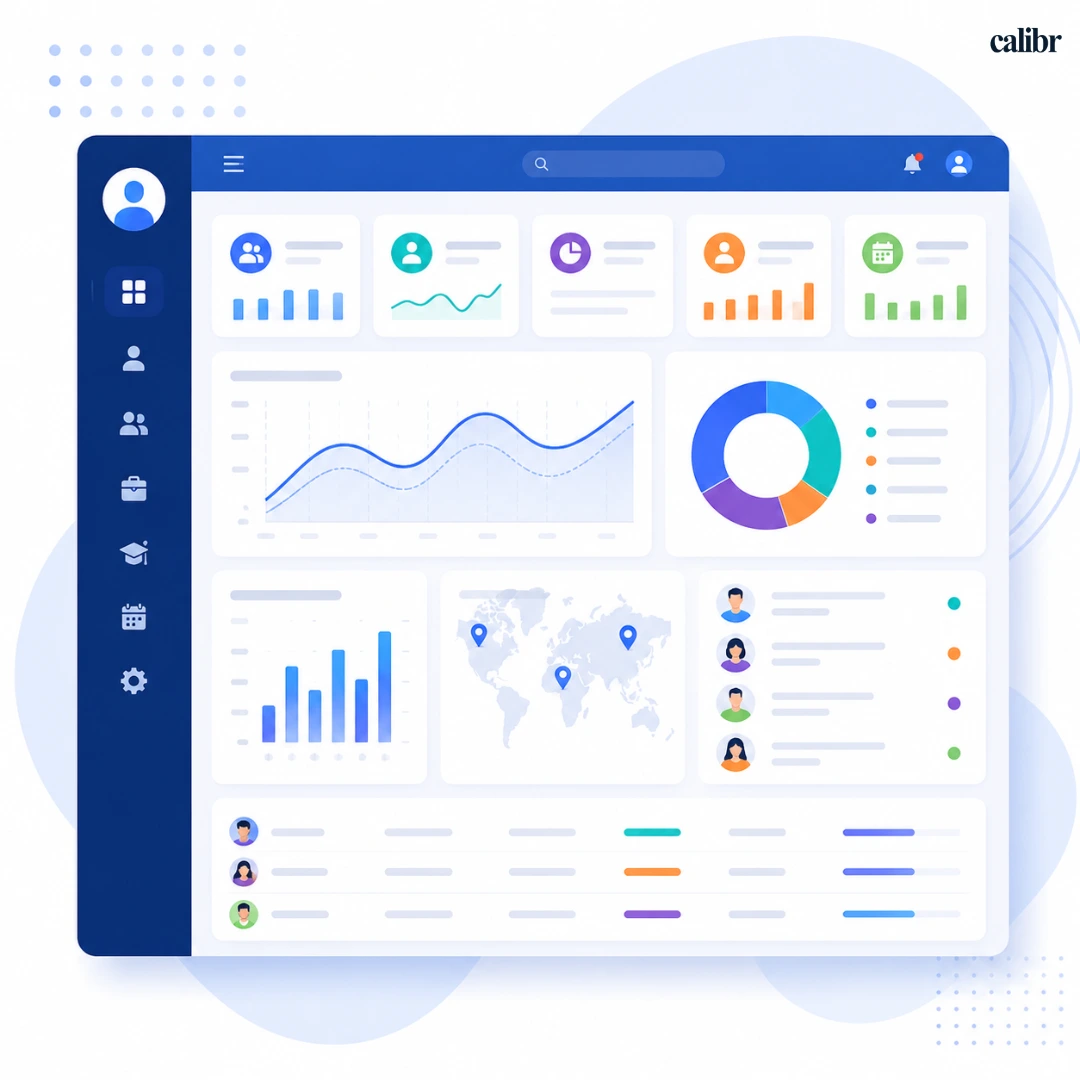
What Is an HR Dashboard?
An HR Dashboard is a visual workspace that consolidates workforce data into charts, KPIs, and reports.
Instead of reviewing multiple spreadsheets, HR teams can monitor hiring, employee retention, employee engagement, employee learning and productivity, diversity, and workforce trends from a single screen.
An effective dashboard should answer three questions:
Question | Dashboard Purpose |
What is happening? | Current workforce metrics |
Why is it happening? | Trends and analysis |
What should we do next? | Actionable insights |
Why Every HR Team Needs an HR Dashboard
Modern HR teams are expected to make decisions using workforce data rather than assumptions.
According to Gallup's State of the Global Workplace Report, global employee engagement remains low, highlighting the importance of tracking workforce health through HR analytics and dashboard reporting.
An HR analytics dashboard helps organizations gain real-time visibility into workforce performance and make faster, data-driven decisions.
How to Build an HR Dashboard in 30 Minutes
Building an HR Dashboard doesn't have to be complicated. By focusing on the right HR dashboard metrics and following a structured process, you can create a useful dashboard in as little as 30 minutes.
The BUILD Framework below provides a simple step-by-step approach for creating an effective HR Dashboard.
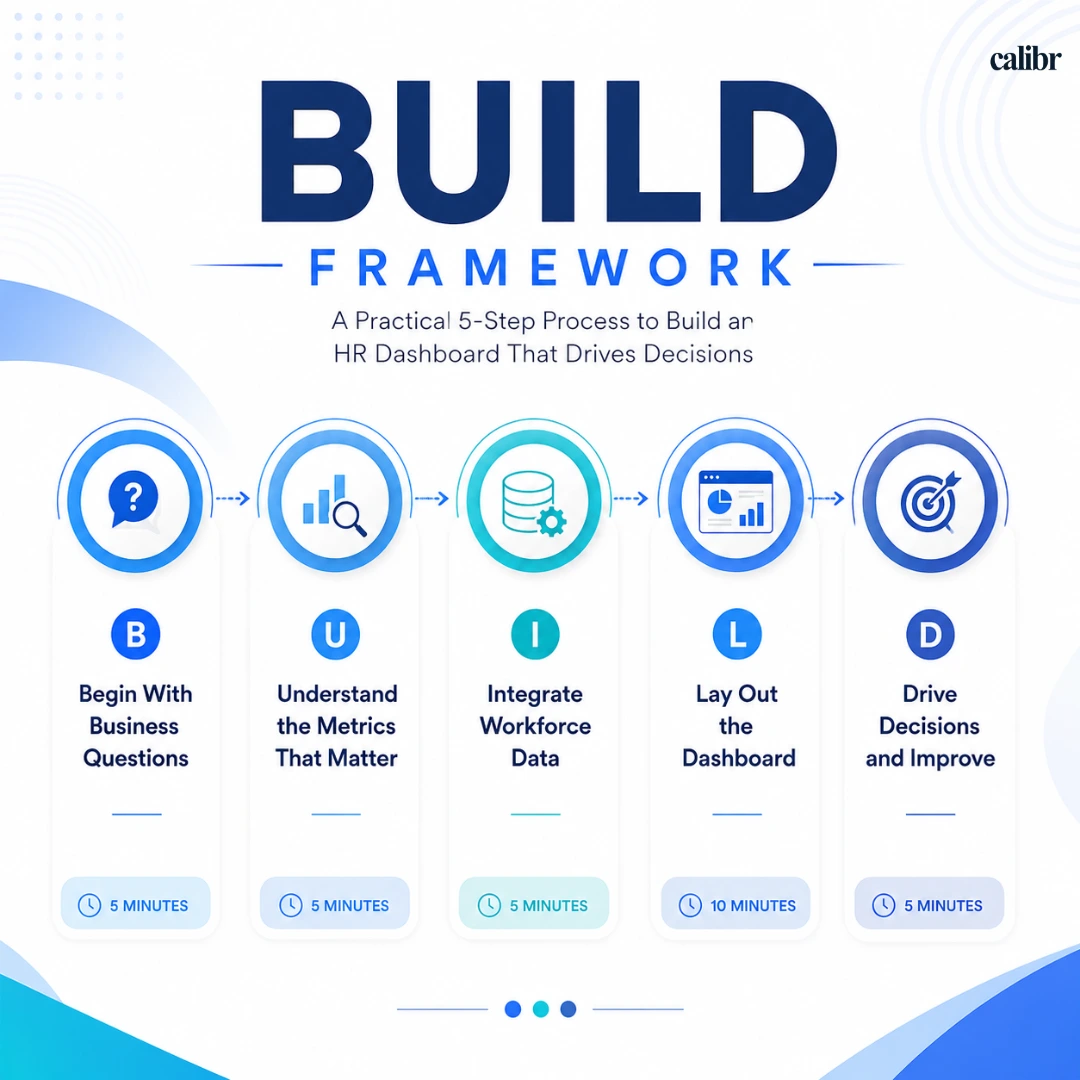
The BUILD Framework: A Practical 5-Step Process
Most HR dashboards fail because teams start with charts instead of business questions.
The BUILD Framework helps HR teams create an actionable dashboard that leadership will actually use.
Step | Focus | Time |
B | Begin With Business Questions | 5 Minutes |
U | Understand the Metrics That Matter | 5 Minutes |
I | Integrate Workforce Data | 5 Minutes |
L | Lay Out the Dashboard | 10 Minutes |
D | Drive Decisions and Improve | 5 Minutes |
Step 1: Begin With Business Questions
Before selecting a single metric, define what decisions the dashboard should support.
Many organizations create dashboards packed with data but fail to answer the questions leaders actually ask.
Start by identifying the biggest workforce priorities.
Ask Questions Like:
Are we losing employees faster than expected?
Which departments have the highest turnover?
How quickly are we filling open positions?
Are employees completing required training?
Is engagement improving or declining?
Which teams require immediate HR attention?
Example
Imagine a growing SaaS company planning to hire 100 employees this year.
Leadership wants answers to three questions:
Business Question | Dashboard Requirement |
Can we hire fast enough? | Recruitment metrics |
Are we retaining talent? | Turnover metrics |
Are employees engaged? | Engagement metrics |
The dashboard should be built around these questions—not around available data.
Quick Tip
If a metric does not influence a business decision, it probably does not belong on the dashboard.
Step 2: Understand the Metrics That Matter
One of the biggest HR reporting mistakes is trying to track everything.
A dashboard with 40 metrics becomes overwhelming and rarely drives action.
Instead, focus on a balanced set of workforce KPIs. If you're unsure which metrics to prioritize, explore our complete guide to HR Metrics to understand the workforce indicators that drive business decisions.
The SHRM HR Metrics Toolkit recommends aligning HR metrics with business objectives rather than tracking large volumes of disconnected data points.
Core HR Dashboard Metrics
Category | Metric | Why It Matters |
Workforce | Headcount | Understand workforce size |
Recruitment | Time-to-Hire | Measure hiring efficiency |
Recruitment | Open Positions | Track hiring demand |
Retention | Employee Turnover Rate | Identify retention issues |
Engagement | Engagement Score | Measure workforce sentiment |
Learning | Training Completion Rate | Evaluate learning effectiveness |
Diversity | Representation Metrics | Support DEI goals |
Attendance | Absenteeism Rate | Monitor workforce availability |
The 80/20 Rule
In most organizations:
20% of metrics drive 80% of workforce decisions.
Focus on the KPIs leaders review every month.
Example Dashboard by Audience
Audience | Metrics They Care About |
CEO | Headcount, Turnover, Hiring |
CHRO | Workforce Trends, Engagement |
Recruiters | Time-to-Hire, Offer Acceptance |
L&D Teams | Training Completion |
Managers | Team Attrition, Attendance |
Different audiences need different dashboard views.
Step 3: Integrate Workforce Data
Now gather data from the systems you already use.
Many HR teams assume they need expensive software before building a dashboard.
In reality, most dashboards start with existing tools.
Tool | Best For | Skill Level |
|---|---|---|
Excel | Small teams and basic HR reporting | Beginner |
Google Sheets | Collaborative HR dashboards | Beginner |
Power BI | Advanced HR analytics dashboards | Intermediate |
Tableau | Interactive workforce analytics | Intermediate |
Looker Studio | Free dashboard reporting and visualization | Beginner |
HRIS Reporting Tools | Real-time workforce reporting | Varies |
Common Data Sources
System | Data Available |
HRIS | Employee Records |
ATS | Recruitment Metrics |
Payroll | Compensation Data |
LMS | Learning Metrics |
Survey Platforms | Engagement Scores |
Attendance Systems | Leave and Absenteeism Data |
Create a Single Source of Truth
One of the biggest causes of reporting errors is inconsistent data.
For example:
HRIS says headcount = 510
Payroll says headcount = 498
Spreadsheet says headcount = 503
Leadership immediately loses confidence.
Before building the dashboard:
✓ Standardize definitions
✓ Verify calculations
✓ Clean duplicate records
✓ Confirm reporting periods
Quick Win
If you're building your first HR dashboard:
Do not wait for perfect systems. Start simple.
Most organizations begin with Excel or Google Sheets and later move to Power BI, Tableau, or dedicated HR analytics dashboard platforms as reporting needs become more sophisticated.
Step 4: Lay Out the Dashboard
This is where most people spend too much time.
A good dashboard should be understandable in less than 60 seconds.
Think like an executive reviewing workforce data before a board meeting.
Layer 1: Workforce Snapshot
Place your most important KPIs at the top.
KPI | Current Value |
Headcount | 850 |
Employee Turnover Rate | 12% |
Open Positions | 25 |
Engagement Score | 79% |
Training Completion | 92% |
This section answers:
"What is happening right now?"
Layer 2: Workforce Trends
The middle section should show trends over time.
Include charts for:
Monthly turnover
Hiring trends
Absenteeism trends
Engagement trends
Training completion trends
This section answers:
"Why is it happening?"
Layer 3: Workforce Alerts
This is the section most dashboards miss.
Instead of only showing metrics, highlight issues requiring action.
Examples
🔴 Sales turnover increased by 18% this month
🟡 Engineering hiring is 12 days behind target
🔴 Customer support absenteeism exceeds threshold
🟢 Training completion reached 95%
This section answers:
"What should we do next?"
Recommended Dashboard Layout
Section | Purpose |
KPI Cards | Current workforce status |
Trend Charts | Historical analysis |
Department Comparison | Team-level visibility |
Alerts & Risks | Actionable insights |
Executive Summary | Key workforce recommendations |
Step 5: Drive Decisions and Improve
Launching the dashboard is only the beginning. The best HR dashboards continuously evolve.
According to Deloitte's Global Human Capital Trends research, organizations increasingly rely on workforce analytics and continuous measurement to improve decision-making and workforce planning.
After the first month, ask stakeholders:
Which metrics are reviewed regularly?
Which metrics are ignored?
What additional insights are needed?
Which decisions were made using dashboard data?
Monthly Dashboard Optimization Checklist
Question | Yes/No |
Are all KPIs still relevant? | |
Is data accurate? | |
Are trends visible? | |
Are alerts actionable? | |
Is leadership using the dashboard? |
The Goal
A successful HR Dashboard is not a reporting tool.
It is a decision-making tool.
If leadership can answer workforce questions, identify risks, and take action within minutes, your dashboard is doing its job.
What Are the Essential HR Dashboard Metrics?
The right HR dashboard metrics depend on your workforce goals, but most organizations track metrics across recruitment, retention, engagement, learning, diversity, and workforce planning.
A well-designed HR Dashboard should provide visibility into workforce health while supporting data-driven decision-making.
Dashboard Section | Recommended Metrics |
|---|---|
Workforce Snapshot | Headcount, Workforce Growth, Open Positions |
Recruitment Dashboard | Time-to-Hire, Time-to-Fill, Cost-per-Hire, Offer Acceptance Rate |
Retention Dashboard | Employee Turnover Rate, Employee Retention Rate, Internal Promotion Rate |
Employee Experience Dashboard | Employee Engagement Score, eNPS, Employee Satisfaction Score, Absenteeism Rate |
Learning & Development Dashboard | Training Completion Rate, Learning Hours per Employee, Certifications Completed |
Diversity & Inclusion Dashboard | Diversity Ratio, Gender Representation, Leadership Diversity |
HR Alerts & Action Center | High Turnover Teams, Hiring Delays, Training Gaps, Engagement Risks |
Quick Tip: An effective HR Dashboard typically includes 5–7 sections and 8–12 core HR dashboard metrics. Start with the metrics leaders use most frequently and expand your HR analytics dashboard as reporting needs evolve.
HR Dashboard Considerations Before You Build
Before building an HR Dashboard, it is important to understand the challenges that often reduce its effectiveness. Many dashboards fail not because of poor tools, but because of poor metric selection, inconsistent data, and a lack of business alignment.
The CIPD People Analytics Factsheet emphasizes that data quality, governance, and business alignment are critical for successful people analytics initiatives.
Common HR Dashboard Mistakes and Solutions
Challenge | Real-World Problem | Solution |
Too Many Metrics | Stakeholders ignore dashboard | Limit to 8-12 KPIs |
Manual Data Collection | Reporting delays | Automate data feeds |
Inconsistent Definitions | Conflicting reports | Standardize metric calculations |
Poor Data Quality | Low trust in reports | Validate source systems |
One Dashboard for Everyone | Low adoption | Create audience-specific views |
Missing Benchmarks | Difficult interpretation | Add targets and comparisons |
No Trend Analysis | Hidden workforce risks | Include monthly trends |
No Action Layer | Dashboard becomes a report | Add alerts and recommendations |
Real-World Considerations
Before building an HR reporting dashboard, ask:
Are the metrics actionable?
If leadership cannot act on a metric, remove it.
Does every metric support a business objective?
Every KPI should answer a specific business question.
Who owns each metric?
Assign ownership to avoid accountability gaps.
How frequently should data update?
The ideal update frequency depends on the type of metric being tracked. Recruitment dashboards are often updated weekly, while workforce and executive dashboards are typically reviewed monthly. Strategic workforce planning metrics can usually be updated quarterly.
Frequently Asked Questions (FAQs)
How do I build an HR dashboard?
Review business goals, align metrics, pull workforce data, create a dashboard layout, and continuously improve based on stakeholder feedback.
What are the most important HR dashboard metrics?
Headcount, employee turnover rate, time-to-hire, engagement score, absenteeism rate, training completion rate, and diversity metrics.
What tools can be used to create an HR dashboard?
Excel, Google Sheets, Power BI, Tableau, Looker Studio, and HRIS reporting platforms.
What is the difference between an HR dashboard and an HR analytics dashboard?
An HR dashboard displays workforce metrics, while an HR analytics dashboard provides deeper analysis, trends, and predictive insights.
How often should an HR dashboard be updated?
Recruitment dashboards are usually updated weekly, while workforce and executive dashboards are commonly updated monthly.
Final Thoughts
If you're wondering how to build an HR dashboard, focus on simplicity before sophistication.
A successful HR Dashboard should:
✓ Track only meaningful HR dashboard metrics
✓ Align with business goals
✓ Include trend analysis and action alerts
✓ Be customized for its audience
✓ Evolve as workforce priorities change
Start with the free HR dashboard template, refine it over time, and transform your HR reporting from manual reporting into strategic workforce intelligence.


Vivetha is a digital marketing professional specializing in content marketing and SEO. She focuses on developing optimized, high-quality content that improves search visibility, supports brand objectives, and drives measurable results. With a structured and analytical approach, she ensures content aligns with business and audience needs.