
People are your organization's greatest asset—but without the right data, even the best HR decisions become guesswork. According to research from SHRM, organizations that use people analytics can make more effective decisions, improve the employee experience, and positively impact business performance.
Similarly, CIPD states that people analytics enables evidence-based decision-making by helping organizations understand their workforce, improve retention, enhance engagement, and measure the impact of HR initiatives.
This guide brings together 75+ essential HR metrics, along with their formulas and why they matter, so you can confidently measure, analyze, and improve every stage of the employee lifecycle.
What Are HR Metrics and Why Are They Important?
HR metrics are measurable indicators used to evaluate workforce performance, recruitment effectiveness, employee engagement, learning outcomes, productivity, and overall HR performance.
They help organizations answer critical questions such as:
Are employees staying or leaving?
Is hiring becoming more efficient?
Are training programs delivering results?
Is employee engagement improving?
Understanding the HR Merics formula is important because numbers without context can lead to poor decisions. For example, knowing your turnover rate alone is not enough; understanding how it compares with retention, absenteeism, and employee engagement provides a more complete picture.
Organizations that regularly monitor HR metrics can improve workforce planning, reduce hiring costs, strengthen retention strategies, and align people initiatives with business goals.
75+ HR Metrics Every HR Leader Should Know
HR metrics help organizations make smarter, data driven decisions across recruitment, retention, engagement, employee learning and performance, workforce planning, and compensation. To make it easy to understand and apply these metrics, we've organized them into logical categories.
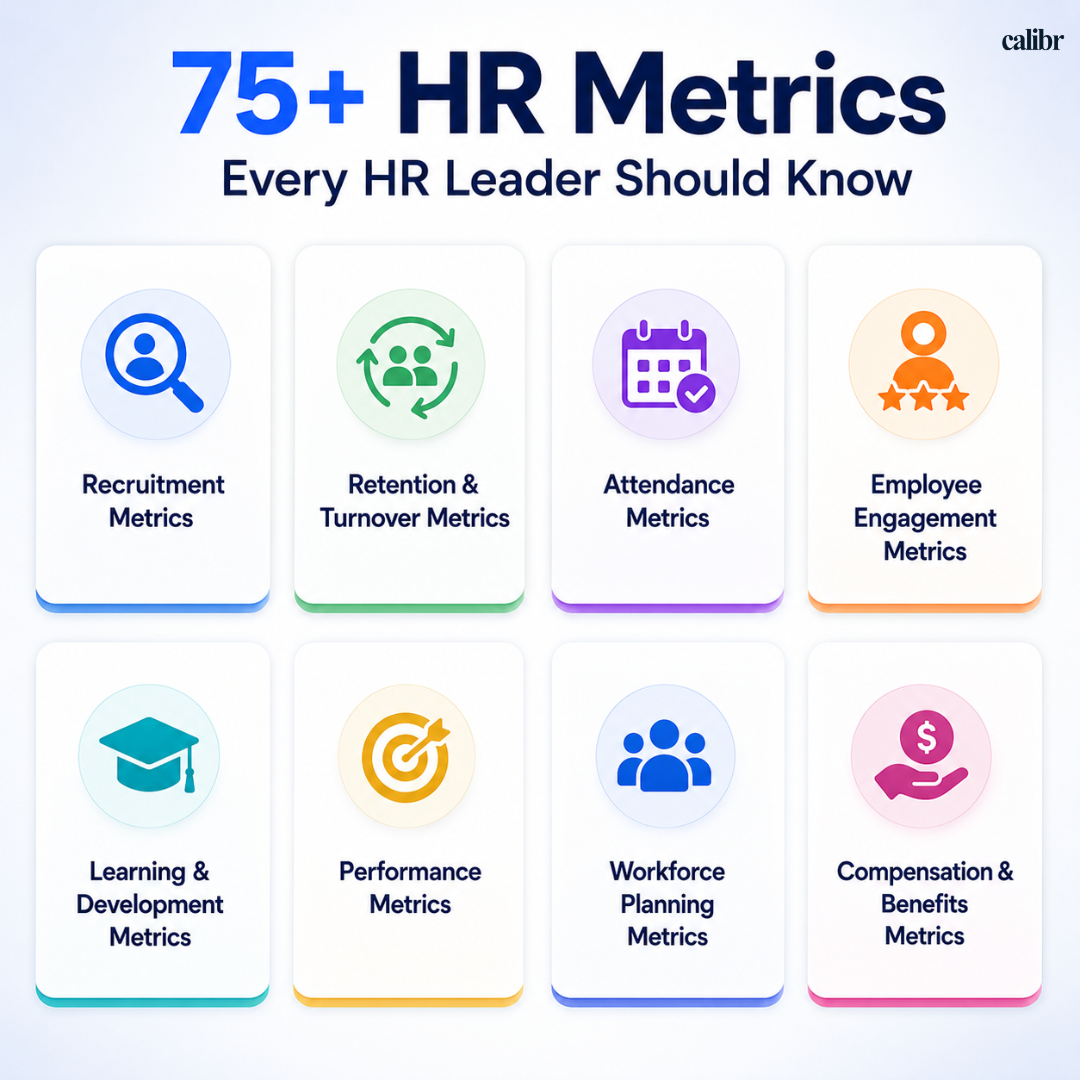
In this guide, each metric includes:
Metric Name – What the metric measures
Formula – How to calculate it
Why It Matters – Why HR teams should track it
Whether you're an HR professional, recruiter, L&D leader, or business executive, this guide provides a practical reference to help you measure what matters most.
Recruitment Metrics
Recruitment metrics measure the effectiveness of your hiring process, from attracting candidates to onboarding new employees. These metrics help HR teams understand how quickly positions are filled, how much hiring costs, and which recruitment channels deliver the best results.
By monitoring recruitment metrics, organizations can reduce hiring delays, improve candidate experience, optimize recruitment spending, and make better talent acquisition decisions. These metrics are especially valuable for recruiters, talent acquisition teams, HR managers, and business leaders responsible for workforce growth.
Metric | Formula | Why It Matters |
Time to Hire | Offer Acceptance Date − Application Date | Measures hiring speed |
Time to Fill | Position Filled Date − Requisition Open Date | Evaluates recruitment efficiency |
Cost per Hire | Total Recruitment Cost ÷ Total Hires | Tracks hiring expenses |
Offer Acceptance Rate | Accepted Offers ÷ Total Offers × 100 | Measures employer attractiveness |
Source of Hire | Hires from Source ÷ Total Hires × 100 | Identifies best hiring channels |
Applicant Conversion Rate | Qualified Applicants ÷ Total Applicants × 100 | Evaluates applicant quality |
Interview-to-Offer Ratio | Offers Made ÷ Interviews Conducted | Assesses screening effectiveness |
Candidate Drop-Off Rate | Withdrawn Candidates ÷ Total Candidates × 100 | Highlights candidate experience issues |
Recruitment Funnel Conversion | Stage Conversions ÷ Previous Stage × 100 | Optimizes recruitment funnel |
Quality of Hire | Performance Score ÷ Total New Hires | Measures hiring success |
Retention and Turnover Metrics
Retention and turnover metrics help organizations understand workforce stability and employee movement. They reveal how many employees stay, how many leave, and whether retention strategies are delivering the desired results.
These metrics are critical for identifying retention risks, improving employee experience, and reducing replacement costs. HR leaders often use them to evaluate workplace culture, employee satisfaction, career growth opportunities, and leadership effectiveness.
Metric | Formula | Why It Matters |
Employee Turnover Rate | Employees Left ÷ Average Headcount × 100 | Tracks employee exits |
Employee Retention Rate | Employees Retained ÷ Starting Employees × 100 | Measures workforce stability |
Voluntary Turnover Rate | Voluntary Exits ÷ Average Headcount × 100 | Identifies resignation trends |
Involuntary Turnover Rate | Terminations ÷ Average Headcount × 100 | Monitors workforce management |
New Hire Turnover Rate | New Hire Exits ÷ New Hires × 100 | Evaluates onboarding success |
Regrettable Attrition Rate | High Performer Exits ÷ Total Employees × 100 | Protects critical talent |
Internal Mobility Rate | Internal Moves ÷ Total Employees × 100 | Measures career opportunities |
Average Employee Tenure | Total Service Years ÷ Employees | Indicates workforce loyalty |
Early Attrition Rate | Employees Leaving Within 1 Year ÷ New Hires × 100 | Assesses hiring quality |
Succession Coverage Ratio | Ready Successors ÷ Critical Roles × 100 | Supports succession planning |
Attendance Metrics
Attendance metrics track employee availability, absenteeism, leave patterns, and overall workforce attendance. They provide valuable insights into productivity, workforce planning, and employee well-being.
Regular monitoring helps organizations identify attendance issues early, manage staffing requirements more effectively, and reduce productivity losses caused by excessive absences. These metrics are commonly used by HR teams, operations managers, and workforce planners.
Metric | Formula | Why It Matters |
Absenteeism Rate | Absent Days ÷ Available Workdays × 100 | Tracks attendance issues |
Sick Leave Rate | Sick Days ÷ Available Workdays × 100 | Monitors employee well-being |
Unplanned Absence Rate | Unplanned Absences ÷ Total Employees × 100 | Identifies attendance risks |
Presenteeism Rate | Employees Working While Ill ÷ Total Employees × 100 | Measures hidden productivity loss |
Overtime Rate | Overtime Hours ÷ Total Hours × 100 | Evaluates workload pressure |
Leave Utilization Rate | Leave Used ÷ Leave Available × 100 | Assesses leave usage patterns |
Attendance Compliance Rate | Days Present ÷ Scheduled Days × 100 | Measures attendance consistency |
Shift Coverage Rate | Filled Shifts ÷ Required Shifts × 100 | Ensures operational continuity |
Lost Workday Rate | Lost Days ÷ Total Workdays × 100 | Quantifies productivity impact |
Return-to-Work Rate | Employees Returned ÷ Employees on Leave × 100 | Evaluates leave management effectiveness |
Employee Engagement Metrics
Employee engagement metrics measure how connected, motivated, and committed employees feel toward their work and organization. They provide insights into workplace culture, leadership effectiveness, and overall employee experience.
Highly engaged employees are often more productive, innovative, and likely to remain with the organization. Tracking engagement metrics helps HR teams identify improvement opportunities and strengthen workforce satisfaction.
Metric | Formula | Why It Matters |
Employee Engagement Score | Total Survey Score ÷ Respondents | Measures overall engagement |
Employee Net Promoter Score (eNPS) | Promoters − Detractors | Measures employee loyalty |
Participation Rate | Survey Responses ÷ Eligible Employees × 100 | Indicates engagement levels |
Recognition Rate | Employees Recognized ÷ Total Employees × 100 | Tracks appreciation culture |
Manager Effectiveness Score | Average Manager Rating | Evaluates leadership quality |
Employee Satisfaction Score | Positive Responses ÷ Total Responses × 100 | Measures workplace satisfaction |
Culture Alignment Score | Positive Responses ÷ Total Responses × 100 | Assesses culture fit |
Trust Index | Trust Responses ÷ Total Responses × 100 | Measures organizational trust |
Feedback Participation Rate | Feedback Participants ÷ Employees × 100 | Evaluates feedback culture |
Well-being Score | Wellness Survey Score Average | Monitors employee wellness |
Learning and Development Metrics
Learning and development metrics evaluate the effectiveness of employee training, skill development initiatives, and organizational learning programs. These metrics help determine whether training investments are improving employee capabilities and business performance.
Organizations use these metrics to identify skill gaps, improve learning participation, and measure the return on training investments. They are especially useful for L&D teams, HR leaders, and department managers.
Metric | Formula | Why It Matters |
Training Completion Rate | Completed Learners ÷ Assigned Learners × 100 | Tracks training participation |
Course Completion Rate | Completions ÷ Enrollments × 100 | Measures course effectiveness |
Training Participation Rate | Participants ÷ Employees × 100 | Evaluates learning adoption |
Knowledge Retention Rate | Post-Test Score ÷ Pre-Test Score × 100 | Measures learning retention |
Training ROI | (Benefits − Costs) ÷ Costs × 100 | Evaluates training value |
Learning Hours per Employee | Total Learning Hours ÷ Employees | Measures learning investment |
Certification Rate | Certified Employees ÷ Participants × 100 | Tracks skill validation |
Skill Gap Closure Rate | Skills Closed ÷ Skills Identified × 100 | Measures capability improvement |
Assessment Pass Rate | Passed Learners ÷ Tested Learners × 100 | Evaluates learning outcomes |
Learning Engagement Rate | Active Learners ÷ Employees × 100 | Measures platform adoption |
Performance Metrics
Performance metrics measure employee productivity, goal achievement, and overall contribution to business objectives. They help organizations evaluate workforce effectiveness and identify high-performing talent.
These metrics support performance management, talent development, succession planning, and reward programs. They also provide valuable insights into workforce productivity and organizational performance.
Metric | Formula | Why It Matters |
Goal Achievement Rate | Goals Achieved ÷ Goals Set × 100 | Tracks performance success |
High Performer Ratio | High Performers ÷ Employees × 100 | Identifies top talent |
Productivity Rate | Output ÷ Input | Measures workforce productivity |
Performance Review Completion | Reviews Completed ÷ Planned Reviews × 100 | Ensures review compliance |
Promotion Rate | Promotions ÷ Employees × 100 | Tracks career growth |
Revenue per Employee | Revenue ÷ Employees | Measures workforce value |
Performance Improvement Rate | Improved Employees ÷ Employees × 100 | Evaluates coaching effectiveness |
Bonus Eligibility Rate | Eligible Employees ÷ Employees × 100 | Supports reward planning |
Goal Completion Rate | Completed Goals ÷ Assigned Goals × 100 | Monitors goal execution |
Workforce Efficiency Ratio | Revenue ÷ Labor Cost | Measures operational efficiency |
Workforce Planning Metrics
Workforce planning metrics help organizations align workforce capacity with current and future business needs. They provide visibility into workforce size, talent availability, diversity, and organizational structure.
By monitoring these metrics, HR leaders can make informed decisions about hiring, succession planning, workforce expansion, and resource allocation.
Metric | Formula | Why It Matters |
Headcount | Total Employees | Measures workforce size |
Vacancy Rate | Open Roles ÷ Total Positions × 100 | Identifies hiring needs |
Span of Control | Employees ÷ Managers | Evaluates management structure |
Workforce Growth Rate | Headcount Change ÷ Previous Headcount × 100 | Tracks workforce expansion |
Diversity Ratio | Diverse Employees ÷ Total Employees × 100 | Monitors workforce diversity |
Gender Representation Rate | Gender Group ÷ Employees × 100 | Supports DEI initiatives |
Workforce Cost Ratio | Labor Cost ÷ Revenue × 100 | Evaluates workforce spending |
Contractor Ratio | Contractors ÷ Workforce × 100 | Assesses workforce mix |
Critical Role Coverage | Filled Critical Roles ÷ Critical Roles × 100 | Reduces talent risk |
Talent Pipeline Strength | Ready Candidates ÷ Open Roles | Supports future hiring |
Compensation and Benefits Metrics
Compensation and benefits metrics evaluate the effectiveness, competitiveness, and cost of employee rewards programs. These metrics help organizations ensure they attract, retain, and motivate talent while maintaining financial sustainability.
They are widely used in compensation planning, salary benchmarking, pay equity analysis, and benefits optimization strategies.
Metric | Formula | Why It Matters |
Compa-Ratio | Salary ÷ Midpoint Salary × 100 | Evaluates pay competitiveness |
Benefits Participation Rate | Participants ÷ Employees × 100 | Measures benefits adoption |
Payroll Cost Percentage | Payroll Cost ÷ Revenue × 100 | Tracks labor cost impact |
Salary Growth Rate | Salary Increase ÷ Previous Salary × 100 | Measures compensation growth |
Pay Equity Ratio | Average Group Salary ÷ Comparison Salary | Supports fair pay practices |
Incentive Participation Rate | Participants ÷ Eligible Employees × 100 | Evaluates incentive effectiveness |
Benefits Cost per Employee | Benefits Cost ÷ Employees | Measures benefits investment |
Variable Pay Ratio | Variable Pay ÷ Total Compensation × 100 | Assesses compensation structure |
Compensation Competitiveness Index | Company Salary ÷ Market Salary × 100 | Benchmarks market pay |
Total Rewards Utilization | Benefits Used ÷ Benefits Offered × 100 | Evaluates rewards effectiveness |
HR Metrics Decision Framework: How to Choose the Right Metrics
Not every HR team needs to track every metric. Start by identifying the business challenge you're trying to solve, then focus on the relevant metric category in this guide.
Hiring challenges? Start with the Recruitment Metrics section to evaluate hiring speed, cost, candidate quality, and recruitment effectiveness.
Retention concerns? Explore the Retention & Turnover Metrics section to understand employee exits, retention trends, and workforce stability.
Attendance or workforce availability issues? Review the Attendance Metrics section to monitor absenteeism, overtime, and leave patterns.
Low employee engagement? Use the Employee Engagement Metrics section to assess workplace culture, satisfaction, and employee loyalty.
Evaluating learning programs? Refer to the Learning & Development Metrics section to measure training participation, knowledge retention, and ROI.
Improving workforce performance? The Performance Metrics section helps evaluate productivity, goal achievement, and employee performance.
Planning future workforce needs? Visit the Workforce Planning Metrics section to support hiring, succession planning, and organizational growth.
Reviewing compensation strategies? The Compensation & Benefits Metrics section helps assess pay competitiveness, benefits utilization, and workforce costs.
Final Thoughts
HR metrics transform workforce data into actionable business insights. By understanding what each metric measures, how it is calculated, and when to use it, HR leaders can make smarter decisions across recruitment, retention, engagement, learning, performance, and workforce planning.
Rather than tracking every metric, focus on the ones that align with your business goals and review them consistently to drive measurable workforce improvements.


Vivetha is a digital marketing professional specializing in content marketing and SEO. She focuses on developing optimized, high-quality content that improves search visibility, supports brand objectives, and drives measurable results. With a structured and analytical approach, she ensures content aligns with business and audience needs.